Start With the Test Your Browser Already Has
"How can I improve the performance of my website?" usually gets answered with a list. Compress your images, drop some scripts, turn on caching. Lists are useful, and we've published a ranked list of website speed fixes of our own, but a list can't tell you which item is your problem. Your site is slow for its own reasons, and the only way to find them is to test it and read the result.
The test is already installed. Chrome carries Google's page-speed engine, Lighthouse, inside its developer tools, and it runs against any page in about a minute. You don't have to interpret the report yourself, either. In 2026, a Tri Counties Bank survey reported by the ABA Banking Journal found 73 percent of small businesses already use AI, with marketing and creative content the most common job at 53 percent. Reading a technical report is squarely the kind of work an assistant does well, provided you hand it the real data instead of a vague complaint.
This guide walks the whole loop with one worked example, and the example is a real site. It's a dental practice in a small Illinois town, built on Webflow, with a video that autoplays behind the homepage headline, a chat widget, and a stack of tracking tags. We're not naming it, since we didn't ask and the point isn't to embarrass anyone, but every number below comes from Lighthouse runs on its live homepage in September 2026. We'll run the audit, read it, hand it to an assistant, and come out with a fix list in the order the owner should work it. Everything here works the same on WordPress, Shopify, Squarespace, Wix, or a hand-built site.
Run Lighthouse in Chrome DevTools, Step by Step
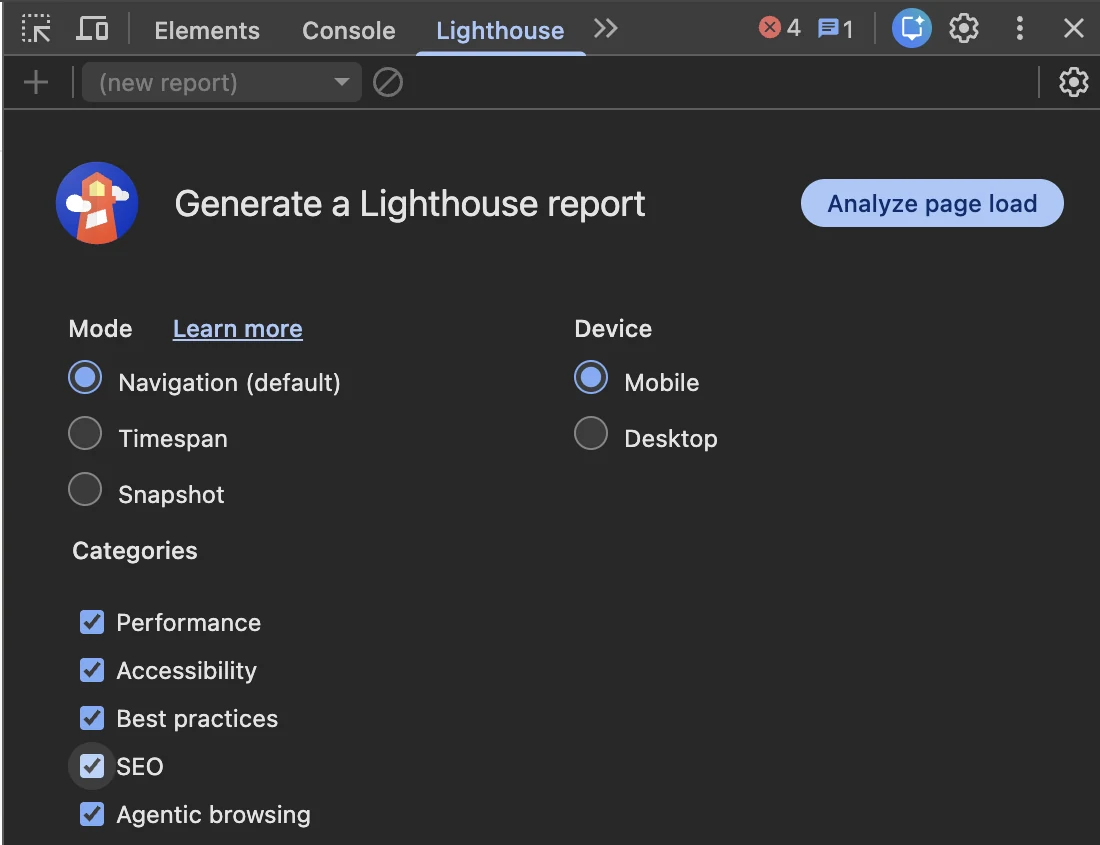
Open Chrome and load the page you want to test, usually your homepage first. Then open the developer tools. Right-click any part of the page and choose Inspect, or press F12 on Windows and Option-Command-I on a Mac. A panel opens beside or below the page with a row of tabs across the top. Click the one labeled Lighthouse. If you don't see it, click the double arrow at the end of the tab row and pick it from the list.
Google's guide to the Lighthouse panel in DevTools lays out the settings, and the defaults are nearly right. Set Mode to Navigation, which measures a full page load. Set Device to Mobile, because that's where most of your visitors are and where Google grades you. Leave every category checked, Performance, Accessibility, Best Practices, SEO, and Agentic browsing, since the extras cost nothing and you'll want them later. Then click Analyze page load and leave the window alone. The page reloads on its own and the report appears after 30 to 60 seconds.
Two habits make the number trustworthy. Run the test in an Incognito window, so your browser extensions and logged-in state don't add weight a visitor never sees. And know what the test simulates. Lighthouse doesn't measure your office connection. By default it applies a 4x CPU slowdown and what Google's throttling documentation calls a Slow 4G connection, about 150 milliseconds of latency and 1.6 megabits per second down, roughly the bottom quarter of 4G connections. That's deliberate. It's the customer in a parking lot with two bars, and a page that's fine for them is fine for everyone.
Read the Report Like a Mechanic Reads a Diagnostic
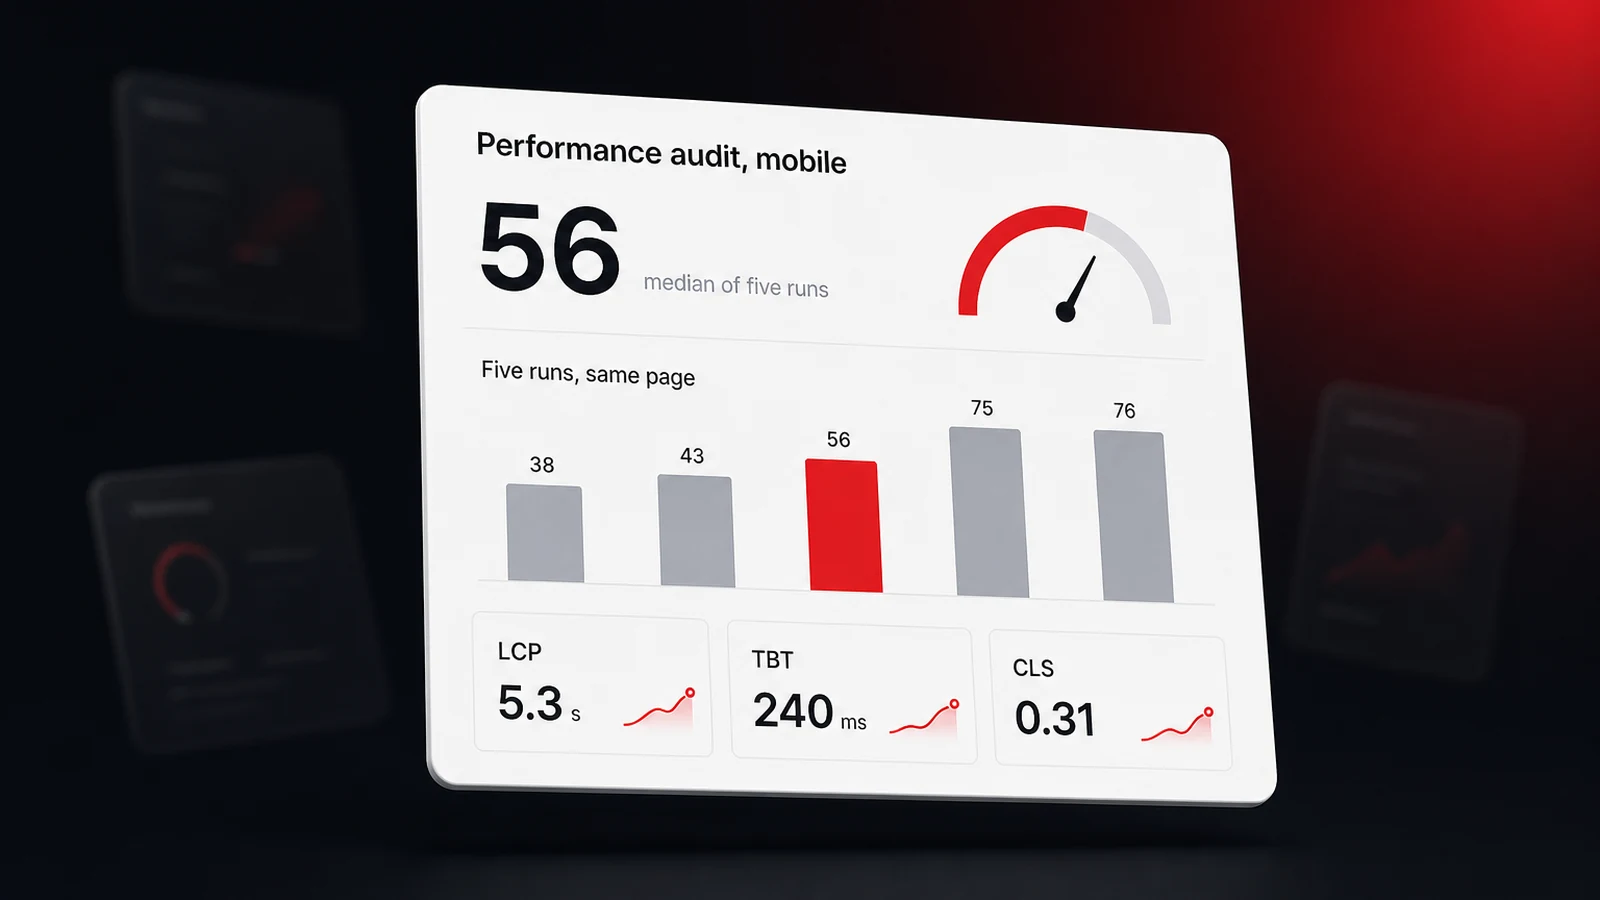
The report opens with one big number, your Performance score out of 100, and a color. Google's Lighthouse performance scoring guide defines the bands. 0 to 49 is red and poor, 50 to 89 is orange and needs improvement, and 90 to 100 is green and good. The same page says a perfect 100 is extremely challenging and not expected, so don't make it the goal. The practice's homepage scored 56 on mobile, orange, which is where a lot of small-business sites with a big hero and a few plugins nobody has pruned end up.
Under the score sit five lab metrics the score is built from, and they don't count equally. Total Blocking Time, how long the page sits frozen while scripts run, carries 30 percent of the score. Largest Contentful Paint, when the biggest thing on screen finishes loading, and Cumulative Layout Shift, how much the page jumps around, carry 25 percent each. First Contentful Paint and Speed Index carry 10 percent each. Those weights set your fix order, because a second shaved off a heavy metric moves the score more than a second off a light one. If the acronyms are new, our plain-English guide to Core Web Vitals and what good looks like covers each one and the thresholds Google uses.
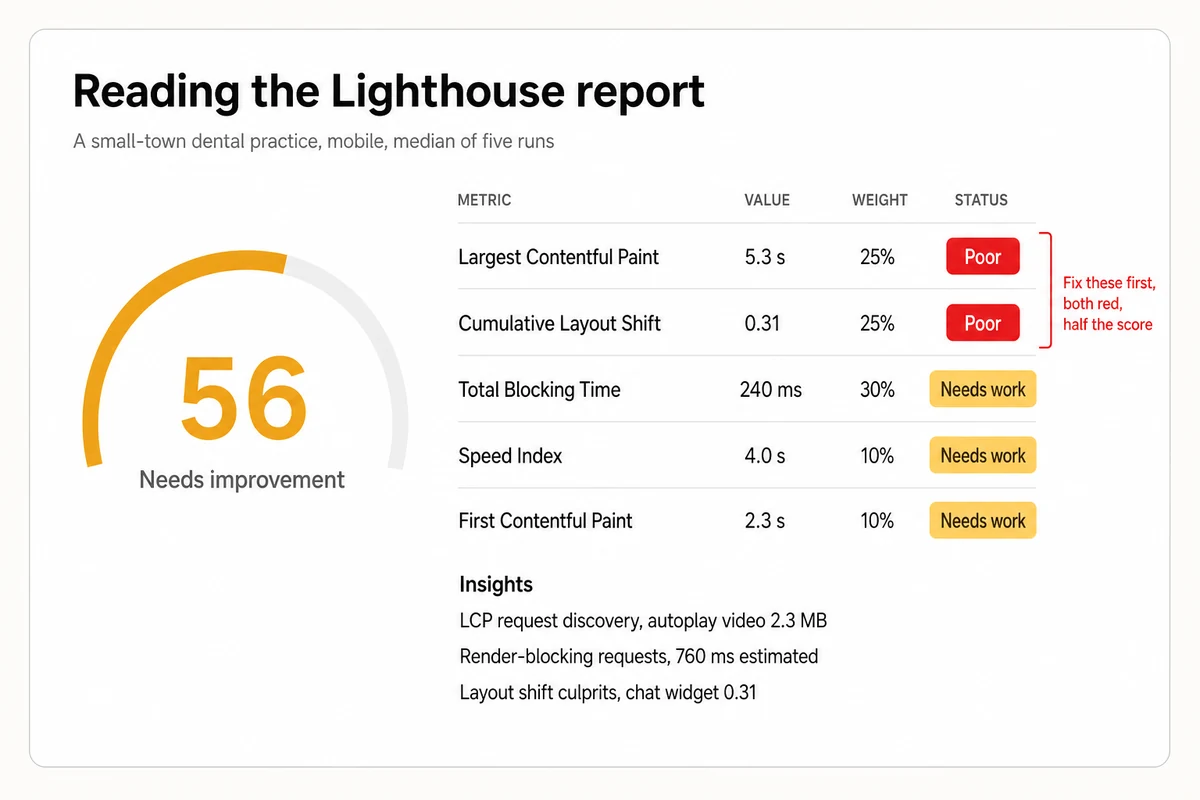
The practice's five read like this. First Contentful Paint 2.3 seconds, Speed Index 4.0 seconds, Largest Contentful Paint 5.3 seconds, Total Blocking Time 240 milliseconds, Cumulative Layout Shift 0.31. Three are orange and two are red, and the red ones decide the fix order. LCP and layout shift carry 25 percent of the score each, so between them they hold half of it, while blocking time at 240 milliseconds sits only a hair past the line Google calls good.
Below the metrics comes the part that changed recently. Older reports split advice into Opportunities and Diagnostics. In 2025 Google moved Lighthouse to insight audits, and with Lighthouse 13 that October it removed the old audits from the report entirely. Each Insight ties a problem to the metric it hurts, the scoring didn't change, and the same Insights now appear in PageSpeed Insights, so a report from either tool reads the same way. The practice's top three were an LCP request discovery insight pointing at the autoplaying video behind the headline, a 2.3 megabyte file, a render blocking requests insight worth an estimated 760 milliseconds, and a layout shift culprits insight that put 0.31 of shift on the chat widget's container, shoved down by a photo further along the page with no set size.
Get the Report Out of Chrome and Into Your Assistant
Before you hand anything over, run the test two or three more times. No single run is the truth. Google's own variability documentation for Lighthouse says scores change from run to run even with no change to the site, and that the median of five runs is twice as stable as one. Write each score down and treat the middle one as your baseline. The practice's five mobile runs came in at 56, 76, 43, 38, and 75, a 38-point spread on the same page inside two minutes, mostly because a 2.3 megabyte video arrives differently every time. Sorted, the middle one is 56, so 56 is the number, and the run that scored 56 is the report you'll hand over. A later single reading of 65 means nothing. A later median of 80 means something changed.
Now the handoff, which is the step most people get stuck on. The report lives only inside Chrome. To give it to an assistant, you save it as a file, then attach that file to a chat the same way you'd attach a photo. Three clicks.
- Save the report. At the top right of the report there's a three-dot menu. Click it and choose Save as JSON. Chrome drops a file into your Downloads folder, named after your site and the date. That file is the whole report written out as text, every score, metric, and insight. JSON is only a format name, and you never need to open the file yourself.
- Attach it in your assistant. Open whichever assistant you use, start a new chat, and click the paperclip or plus button beside the message box. Pick the file from Downloads. It appears as an attachment, and the assistant can read all of it.
- Type the prompt. With the file attached, paste in the triage prompt from the next section and send it. That's the entire handoff.
If your assistant won't take a file, go back to the same three-dot menu and choose Copy JSON instead. That puts the report text on your clipboard, so paste it into the chat directly under your prompt. It's long, thousands of lines, and that's fine, the assistant reads it the same way. Keep the saved files, too. Google's Lighthouse Report Viewer reopens any of them later and can compare two side by side, which is how you prove a fix worked.
The First Prompt Is a Triage, Not a Fix Request
Most people paste a report into an assistant, type "how do I fix this," and get back a generic list that could apply to any site. The remedy is to ask for a triage first. Tell the assistant what platform you're on and what you can and can't touch, attach the saved report, and ask it to sort the findings by the metric weights rather than by whatever it notices first. Here's the prompt we used on the practice's report, with blanks for your own site.
I run a small business website and I'm not a developer. I ran a Lighthouse performance audit in Chrome DevTools on my homepage (mobile, median of 5 runs). My site is built on [WordPress, Shopify, Squarespace, Wix, or other]. I can change settings, install or remove plugins and apps, and replace images. I can't edit theme code or server settings without help.

My full Lighthouse report is attached as a file (or pasted below if attachments are not supported).
[attach the saved report file here, or paste the copied report text]

Do not suggest fixes yet. First, give me a triage:
1. List my five metric values and say which two are hurting the score most, using Lighthouse's weights (TBT 30%, LCP 25%, CLS 25%, FCP 10%, Speed Index 10%).
2. Group every Insight under the metric it affects, and name the specific file, script, or element the report points at, with its size or time.
3. Label each item DIY (I can do it in my site builder), DEVELOPER (needs code), or SKIP (not worth the effort for the gain).
4. Ask me any questions you need answered before recommending a first fix.
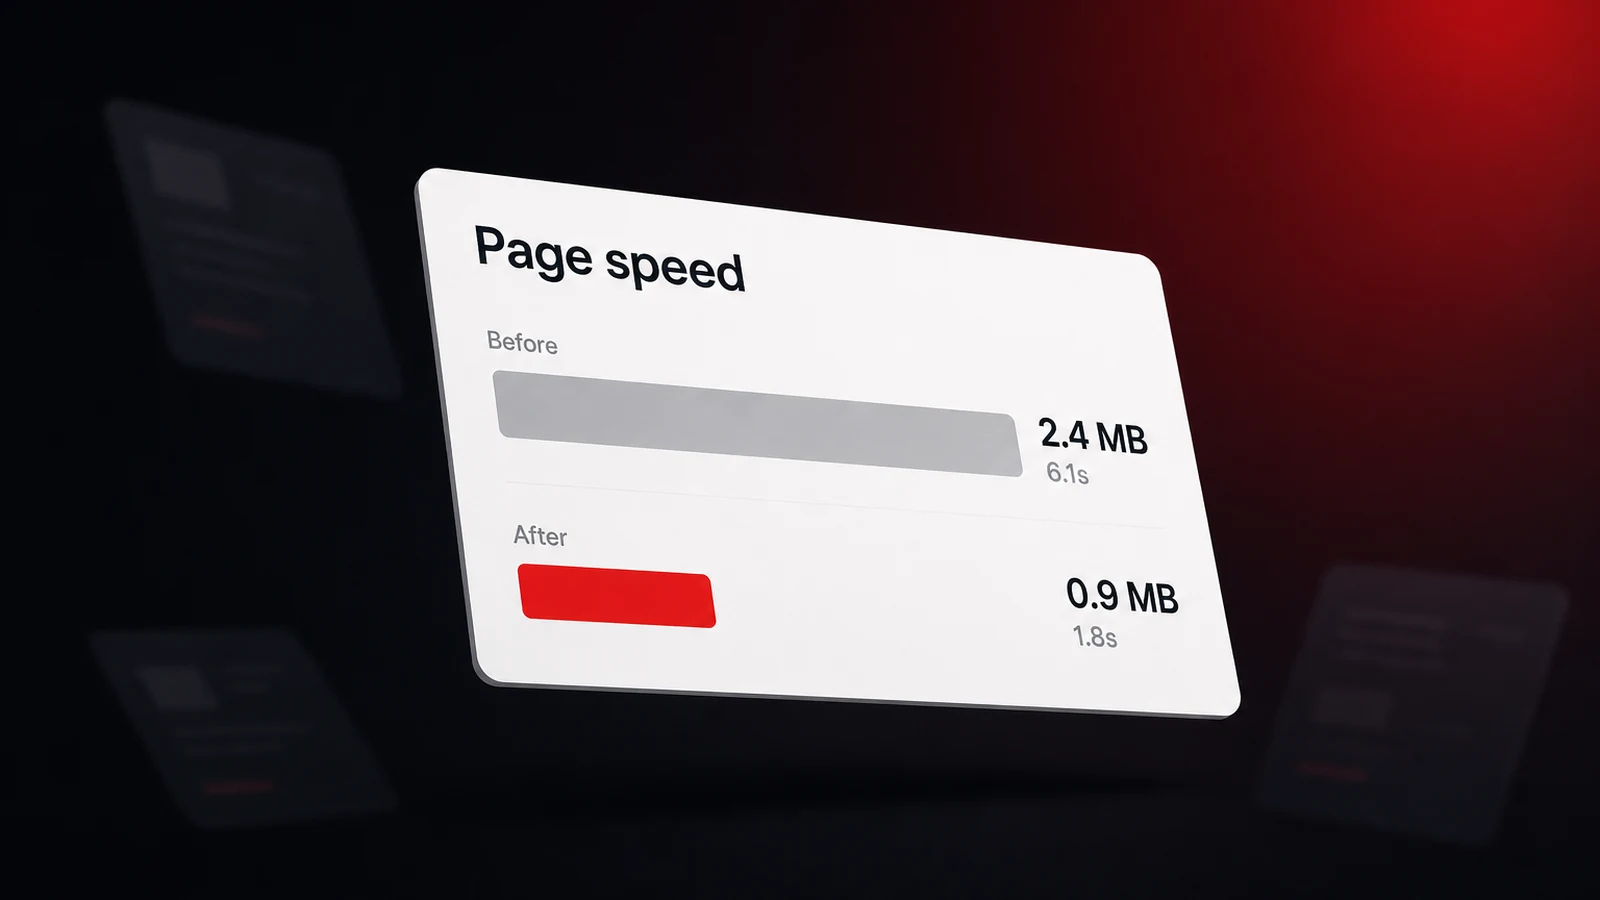
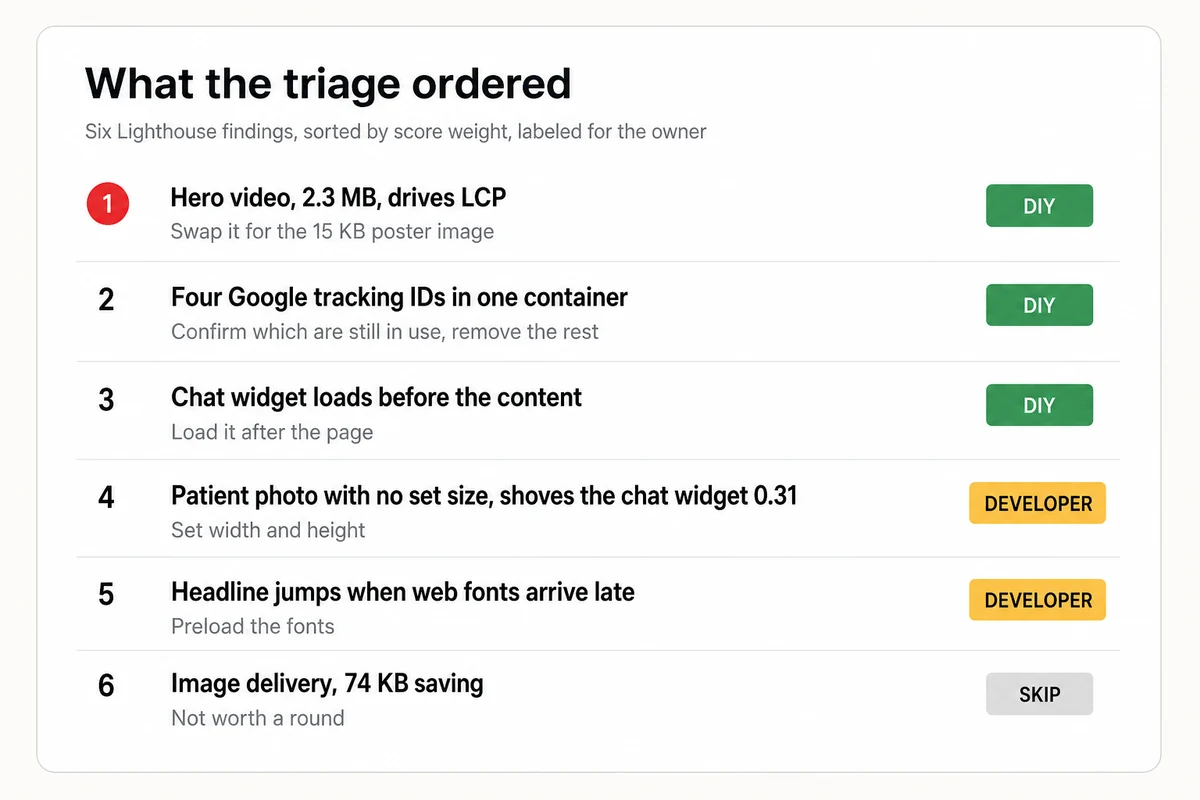
The triage that came back was short and specific, which is the point. The biggest thing on the screen is a background video that autoplays behind the headline, 2.3 megabytes served with no cache headers, and it alone explains the 5.3-second LCP. Swapping it for a still image is a DIY change in the Webflow designer, and the video's own poster frame is a 15 kilobyte JPEG that would do. The blocking time traces to a Google Tag Manager container that loads four separate tracking IDs, plus a Facebook pixel, a LinkedIn pixel, and a chat widget, and Lighthouse counts about 370 kilobytes of script across the page that loads but never runs. DIY, once someone confirms which of the four Google tags are still in use. The layout shift is the chat widget's container being pushed down by a patient photo with no width or height set, and the headline jumping when its web fonts arrive late. Labeled DEVELOPER, since it means editing image and font settings. The remaining insights, a 74 kilobyte image saving and a 100 millisecond font display gain, got SKIP. And it asked one good question, whether four Google tracking IDs on one homepage was deliberate or the residue of past agencies. Only the owner can answer that, and it's the first thing to settle before anyone touches the scripts.
Work in Rounds, One Fix per Run
Now fix things, but in rounds, and re-run after each one. One change per round is slower than doing everything at once, and it's the only way to learn which change did what. If you fix five things and the score moves twenty points, you know nothing about which one worked. Keep a plain log, the date, what you changed, and the new median score.
For the practice, the order fell straight out of the triage. Round one is the video, because it's the LCP element, it's the heaviest file on the page, and it's a settings change. Round two is the tag cleanup and moving the chat widget to load after the page, once the owner has answered the four-tracking-IDs question. Round three is the developer work, sizing the photo and the fonts so the layout holds still. Lighthouse's own estimates say roughly what each is worth before you start, 760 milliseconds of render blocking and 370 kilobytes of unused script on the table, and a 2.3 megabyte file that simply stops being downloaded. We don't have the keys to this site, so we can't show you its after, and a made-up number would teach you nothing. What we can tell you is how to know when yours worked.
Each round starts with a follow-up prompt in the same conversation, so the assistant keeps the context. After the re-run, attach the new report file and ask for the comparison.
I made one change: [describe it, e.g. replaced the hero image with a 180 KB WebP at 1600px wide]. My new Lighthouse report is attached (median of 5 runs).
[attach the new report file, or paste it]

1. Compare the five metrics to the previous report and tell me what moved and by how much.
2. Did anything get worse? If so, why?
3. What is the single next fix with the biggest expected gain for the least effort? Give me the exact steps for [my platform], including the menu path or setting name.
4. Tell me what could break if I do it, and how to undo it.
One more rule, learned the hard way. Measure on the live page, never on a downloaded copy. We tried the practice's fixes on a saved copy of its homepage, and the copy loaded so differently from the real thing, a different element counted as the LCP and the menu shifted where the chat widget had, that the numbers meant nothing. The report has to come from the page your customers actually get.
Know when to stop, too. The last ten points cost more than the first forty, and past a point the fixes start requiring rebuilds a five-page site doesn't justify. When a round moves the score by less than the run-to-run noise, you're done for now.
Where AI Gets It Wrong, and How to Catch It
An assistant reading a real report is far more useful than one guessing from a description, but it still gets things wrong, and the developers who use these tools daily will tell you so. Stack Overflow's developer survey on AI tools, published in 2025, found 46 percent of developers distrust the accuracy of AI tools against 33 percent who trust it, and 66 percent named answers that are almost right but not quite as their top frustration. Almost right is exactly the failure to watch for here. A plugin that doesn't exist for your platform, a setting under a menu renamed a year ago, or a snippet that lifts the score and breaks your contact form.
Four guards catch most of it. Ask for the exact menu path, not "enable lazy loading," and if the path isn't on your screen, say so and ask again rather than hunting. Never paste code into theme files or a site header without a backup and a way back, and if the answer involves code at all, that's your cue to hand the round to a developer. Ask what could break before every change, because the assistant will tell you if you ask and won't if you don't. And trust the re-run over the explanation. If the assistant says a change should help LCP and the median didn't move, the change didn't help, however sound the reasoning sounded.
One more boundary. The Lighthouse score is a lab test on a simulated phone and connection. It tells you what to fix. It doesn't tell you how your real visitors experience the page, which Google measures separately from actual Chrome users and reports in Search Console. A green lab score beside field data that still fails usually means your visitors are on worse phones than the simulation, and the fix order is the same, only the bar is higher.
Let Chrome's Own AI Read the Trace
You may not need to copy anything at all. Chrome now has an AI assistance panel of its own, built into DevTools and powered by Gemini. In the Performance panel, expand any insight and there's a Debug with AI button that opens a chat with the trace already loaded, and Google's AI assistance documentation for performance says it can record a fresh trace and pull in the relevant network requests and page elements on its own. With Chrome 149 in June 2026, the DevTools release notes added access to Lighthouse and its insights, so the assistant can weigh the whole page rather than one trace, and every conversation now ends with a Copy to coding agent button that packages the chat as a prompt for whichever assistant does your fixing.
The catches are real, so check them before you plan around it. Per Google's setup requirements, you need to be signed into Chrome with a Google account, at least 18, in a supported country, with DevTools set to English (US) and the AI Innovations setting switched on. Outside those conditions the panel doesn't appear, and the copy-and-paste workflow above is your route.
If you have a developer, or you're comfortable with coding tools yourself, there's a further step. In September 2025 Google released the Chrome DevTools MCP server, which lets an AI coding agent drive a real Chrome window, record a performance trace, read the network and console, and check its own fix by reloading the page. The announcement names the problem it solves plainly, that coding agents can't see what the code they generate does once it runs in a browser. For a site with custom code, that closes the loop this whole guide is about, with the agent running the audit, making the change, and re-running, while you approve each step.
A Faster Page Is Only the First Question
The practice's five runs took two minutes and the triage took one prompt, and together they came back as a three-round plan a non-developer can start on today, with the one developer round clearly marked. The method is the lesson. Measure with the tool already in your browser, read the report by its weights, hand the real data to an assistant with a triage prompt, fix one thing per round, and let the median of five runs, not the explanation, decide whether it worked.
Speed is worth the afternoon, and it's still only the floor. A page that loads fast is easier for Google to rank, as a tiebreaker rather than a headline signal, and easier for an AI assistant to read when it decides which local business to name. Our free AI visibility audit weighs your site's speed beside the other on-site signals those assistants read, then ranks what to fix. Once the site is fast, the harder question is whether the assistants actually recommend your business when a customer asks, and that's precisely what Lighthouse Local's AI visibility tracker answers, week after week. Lighthouse Local for Business shows what that tracking covers at each level. Run Lighthouse, read the number, and fix the heaviest thing first.
Frequently asked questions
How do I run a Lighthouse audit in Chrome?
Open the page in Chrome, right-click and choose Inspect or press F12, click the Lighthouse tab, set Mode to Navigation and Device to Mobile, and click Analyze page load. The report appears in about a minute. Use an Incognito window so your extensions don't skew it, and run it three to five times.
How do I give my Lighthouse report to an AI assistant?
Click the three-dot menu at the top of the report and choose Save as JSON, which puts a file in your Downloads folder. Then start a chat in your assistant, attach that file with the paperclip button, and type your prompt. If your assistant can't take files, choose Copy JSON instead and paste the text into the chat.
What is a good Lighthouse performance score?
Google's bands are 0 to 49 poor, 50 to 89 needs improvement, and 90 to 100 good. Most small-business sites start in the red or low orange on mobile. Aim for green, and don't chase a perfect 100, which Google itself calls extremely challenging and not expected.
Can AI fix my website's speed for me?
It can read your Lighthouse report, sort the problems by impact, and give platform-specific steps, and you make the changes. Chrome's built-in AI assistance and the Chrome DevTools MCP server go further for developers. Verify every fix by re-running the audit, since AI answers are often almost right.
Why does my Lighthouse score change every time I run it?
Network and device conditions vary between runs, so Google's guidance is to run it several times and use the median, and it says five runs are twice as stable as one. Treat a swing of a few points as noise and only a larger shift as real.