The Speed Scores Google Keeps on Your Site
In plain English, Core Web Vitals are three scores Google gives your site for how fast and steady it feels to a real visitor. Someone told you your website "fails Core Web Vitals," or that your LCP is too high, and it landed like a foreign language. That's normal. Google wrapped a pile of engineering jargon around a simple idea, then started grading every site on it.
Here's the idea underneath the acronyms. When real people visit your pages, Google quietly measures how the experience feels. Does the page show up fast, or do visitors stare at a blank screen? When they tap a button, does it react, or hang? Does the layout hold still, or jump around while things load? Those three feelings, turned into numbers, are your Core Web Vitals. Google publishes the exact thresholds and grades your site against them whether you look or not.
Inside Your PageSpeed Score
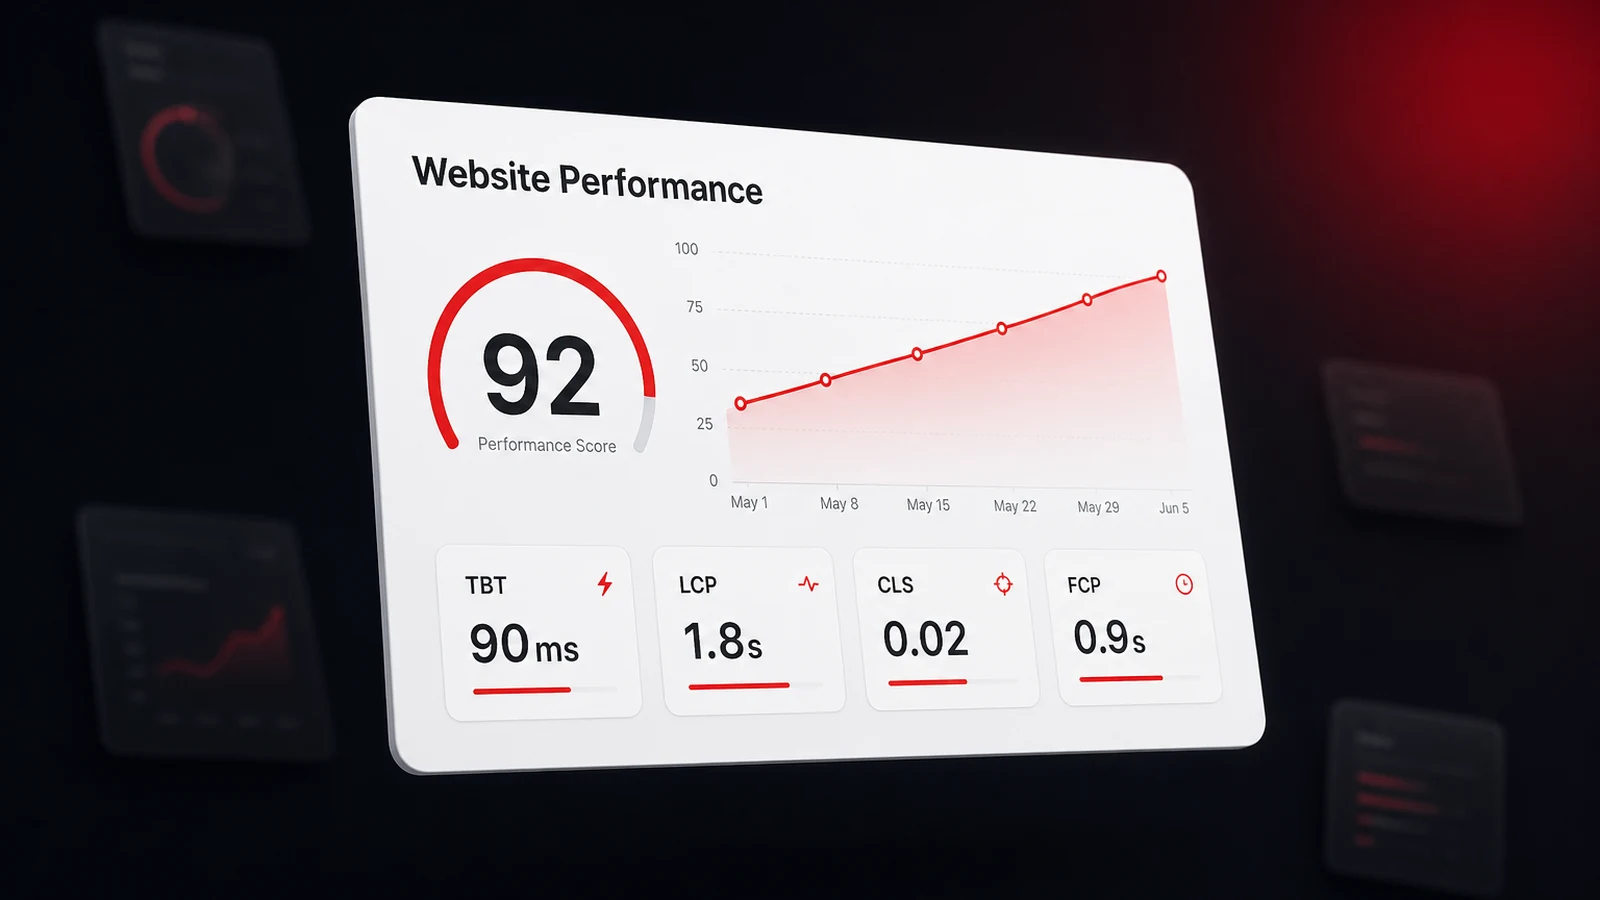
Two lists of metrics matter here, and people constantly mix them up. Google's Core Web Vitals are the three it uses to rank you, measured on your real visitors, Largest Contentful Paint, Interaction to Next Paint, and Cumulative Layout Shift. Your PageSpeed score is a related but separate thing, a lab test that grades five metrics and rolls them into one number from 0 to 100.
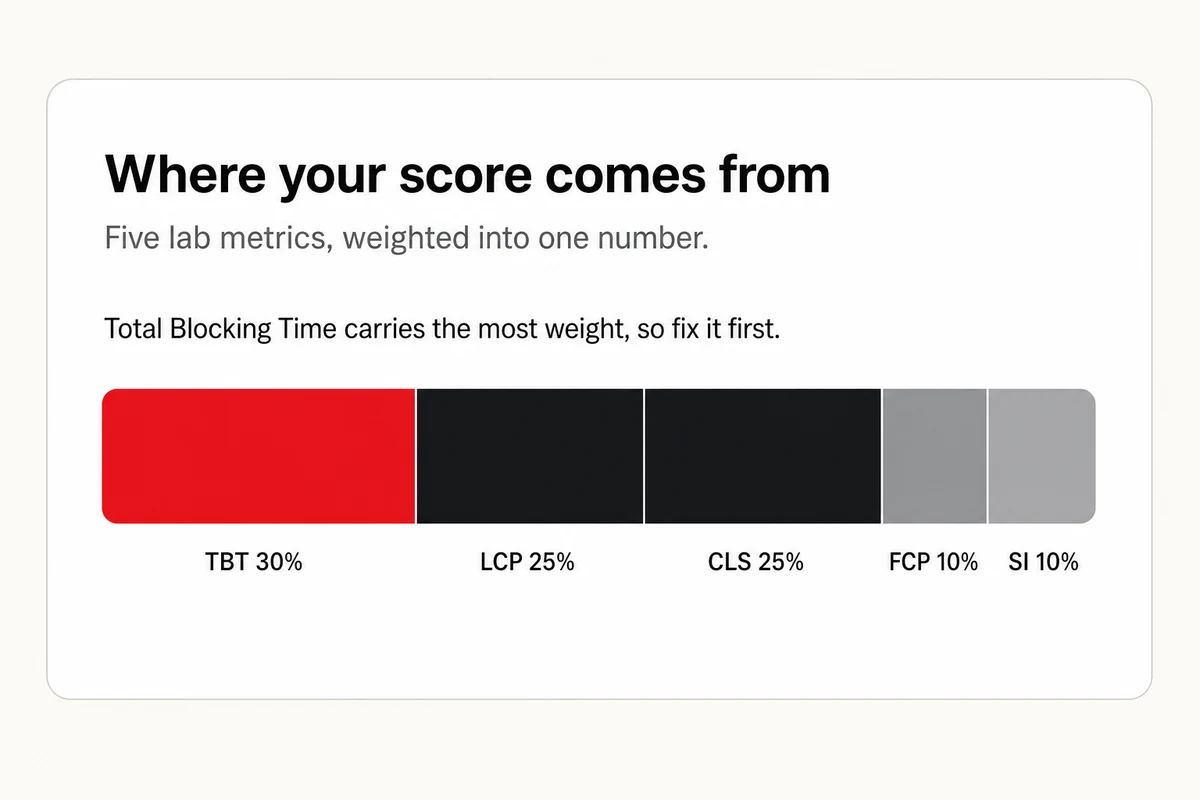
When the goal is a better score, those five lab metrics are what you fix, and they don't count equally. Three of them are new here. Total Blocking Time measures how long your page sits frozen and unresponsive, First Contentful Paint is the moment the first content appears, and Speed Index is how fast the page visually fills in. Total Blocking Time carries the most weight by far, so work the list in order, heaviest first.
| Metric | Weight | Good target | The usual cause |
|---|---|---|---|
| Total Blocking Time (TBT) | 30% | Under 200ms | Heavy third-party scripts |
| Largest Contentful Paint (LCP) | 25% | Under 2.5s | A big hero image, a slow font, or a render-blocking script |
| Cumulative Layout Shift (CLS) | 25% | Under 0.1 | No reserved space for images, ads, or fonts |
| First Contentful Paint (FCP) | 10% | Under 1.8s | Non-critical code loading first |
| Speed Index (SI) | 10% | Under 3.4s | Offscreen images and scripts loading too early |
One thing surprises people the first time. Your Core Web Vitals include Interaction to Next Paint, but you won't find it in the lab report. INP can only be measured on real visitors, so Lighthouse shows Total Blocking Time in its place. Largest Contentful Paint and Cumulative Layout Shift appear in both lists. INP lives only in the real-user data.
The Real Reason Slow Sites Lose Out
Two reasons this is worth your attention, and neither is vanity.
First, Google uses Core Web Vitals as a ranking signal. It isn't the biggest one. Relevance and reputation still decide most of the fight, so think of speed as a tiebreaker. When your page and a competitor's are otherwise evenly matched, the faster, steadier one takes the spot. Google has folded real-user speed into ranking since 2021, so this isn't new, just badly explained.
Second, a slow, jumpy page costs you customers on its own, before ranking even enters into it. People leave before it loads. And the same clean, fast foundation that pleases Google also makes your pages easy for crawlers and AI models to read, which feeds straight into which businesses AI recommends. Speed alone won't get you named, but a site that's slow and hard to parse gives the machines every reason to skip you.
Measure Yours in Two Minutes, Free
You don't need a paid tool or a developer to see your scores, and there are two free ways to pull them up.
The fastest, and where most people should start, is Google's own PageSpeed Insights. Paste your web address, click "Analyze," and in a few seconds you get your Core Web Vitals two ways, a fresh lab test and, once Google has enough traffic on your site, the real numbers from your actual visitors over the past month. Nothing to install. For most business owners, that's the whole job.
The second way runs the same engine right inside Chrome, and it's called Lighthouse. Confusingly, it shares a name with us, so to be clear, this Lighthouse is Google's. It's handy for testing a page while you work on it.
- Open your website in Chrome.
- Right-click anywhere on the page and choose "Inspect" to open the developer tools.
- In the panel that opens, find the "Lighthouse" tab. You may have to click the ">>" arrows to reveal it.
- Pick "Mobile," tick "Performance," and click "Analyze page load."
Either tool hands you the same thing, a Performance score from 0 to 100, each metric behind it flagged good, needs work, or poor, and two lists that matter most, "Opportunities" and "Diagnostics." One note on the numbers. A lab test is a single snapshot from one machine, great for finding problems, while the field data in PageSpeed Insights is what real visitors actually feel, so trust that for the verdict. And don't fixate on the score itself. The gold is in those two lists, and that's where AI comes in.
Turn the Report Into Fixes with AI
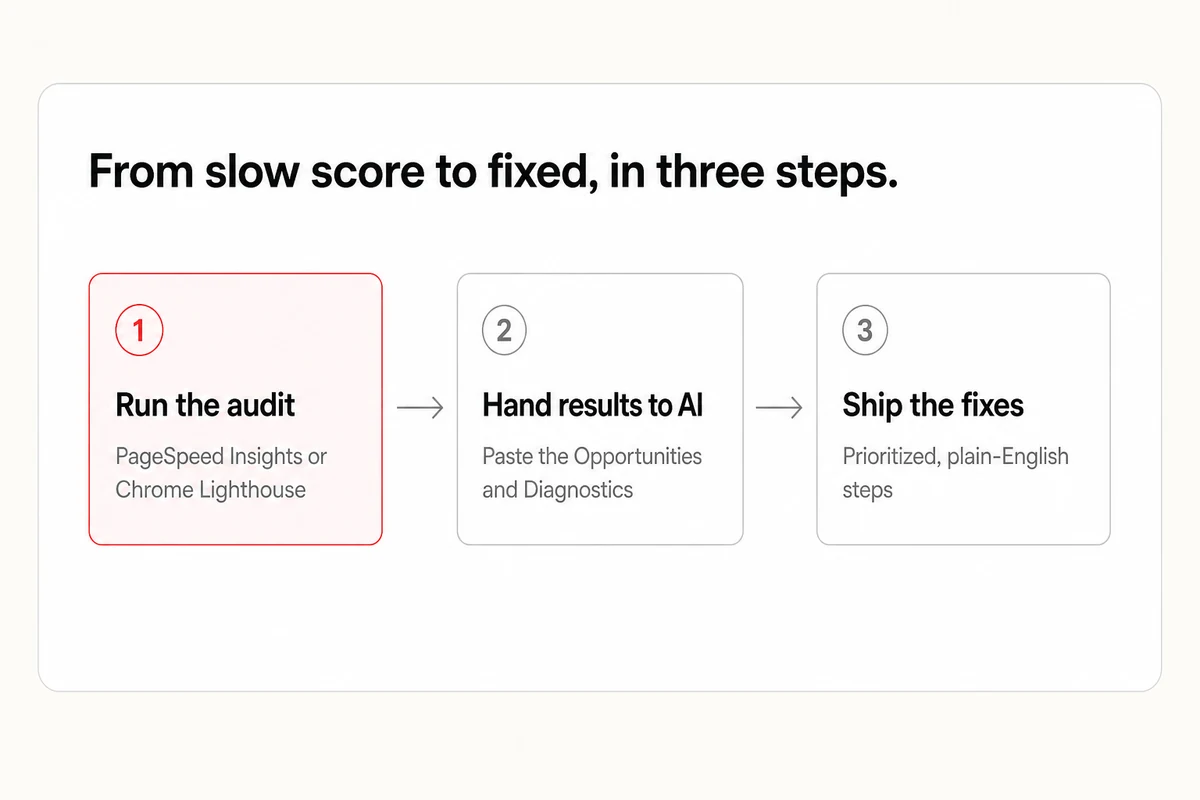
Lighthouse tells you what's wrong in developer language. An AI assistant turns that into plain steps you can actually follow. Copy your results, or a screenshot of them, and hand them over with a prompt like this.
I ran a Google PageSpeed Insights report on my website and I'm not a developer. Here are the results.

[paste your Performance score, plus the Opportunities and Diagnostics lists, or attach a screenshot]

Please help me with three things.

1. In plain English, tell me which issues are hurting my Largest Contentful Paint, Interaction to Next Paint, and Cumulative Layout Shift the most.

2. Give me the fixes in priority order, and mark which I can do myself in my website builder versus which need a developer.

3. For each fix I can do myself, walk me through it step by step on [my platform, for example WordPress, Shopify, or Squarespace].

My website is [paste your URL].
What comes back is a prioritized, plain-English to-do list, split into what you can handle in your site builder and what needs a developer. For most small businesses the fixes are the same short list, compressing oversized images, dropping a heavy plugin or two, and reserving space for images and ads so the page stops jumping as it loads. If you already lean on AI to build or edit your site, this is the same move you'd use to add an llms.txt file or your local schema markup, hand the machine the spec and let it do the wiring.
What a Perfect Score Won't Buy You
Before you chase a perfect 100, a dose of honesty. The score is a means, not the goal. A 100 on a page nobody can find, or that doesn't answer what a buyer is asking, still loses to a relevant 80. Speed is the tiebreaker, remember, not the whole match.
Two more things worth knowing. Your lab score and your real-world score will differ, sometimes by a lot, because your visitors are on slower phones and worse connections than your test machine. Trust the field data for the verdict. And past a point, the last few points cost far more than they return, so fix what's easy and high-impact, then stop. The goal is a page that feels fast to a real person, not a screenshot of a green 100.
A Fast Site Is the Floor, Not the Finish
A fast, stable site is the floor. It clears you to compete, keeps visitors from bouncing, and makes you easy for machines to read. But clearing the floor isn't the same as winning. Being quick to load and being the business an assistant names when a customer asks are two very different things.
That last mile is what Lighthouse Local's AI visibility tracker measures. It runs your real customer questions across ChatGPT, Gemini, Claude, Perplexity, and Google AI, then shows whether you're the name that comes back or the one that's missing. Our free AI audit grades your site in a click and hands back the fixes worth making first, no account required, and if you'd rather see whether AI names you, you can check whether AI recommends you in about twenty minutes. So get your speed sorted, then find out where you actually stand.
Frequently asked questions
What are Core Web Vitals, in one sentence?
They're the three scores Google uses to grade how fast and steady your pages feel to real visitors, Largest Contentful Paint for loading, Interaction to Next Paint for responsiveness, and Cumulative Layout Shift for visual stability.
What counts as a good LCP, INP, and CLS score?
Under 2.5 seconds for LCP, under 200 milliseconds for INP, and under 0.1 for CLS, measured across your real visitors. Clear all three and Google rates your Core Web Vitals as good.
Do I need a developer to improve my site speed?
Often not for the first round. Run Chrome's built-in Lighthouse, hand the results to an AI assistant, and it'll sort the fixes into what you can do in your site builder and what needs a developer. Compressing images and reserving space for elements are usually do-it-yourself.
Does site speed really affect my Google ranking?
Yes, but as a tiebreaker. Core Web Vitals are a ranking signal, not the main one. Relevance and reputation matter more, so speed mostly decides close calls between otherwise similar pages.