Four Feeds, One Page, Built in an Afternoon
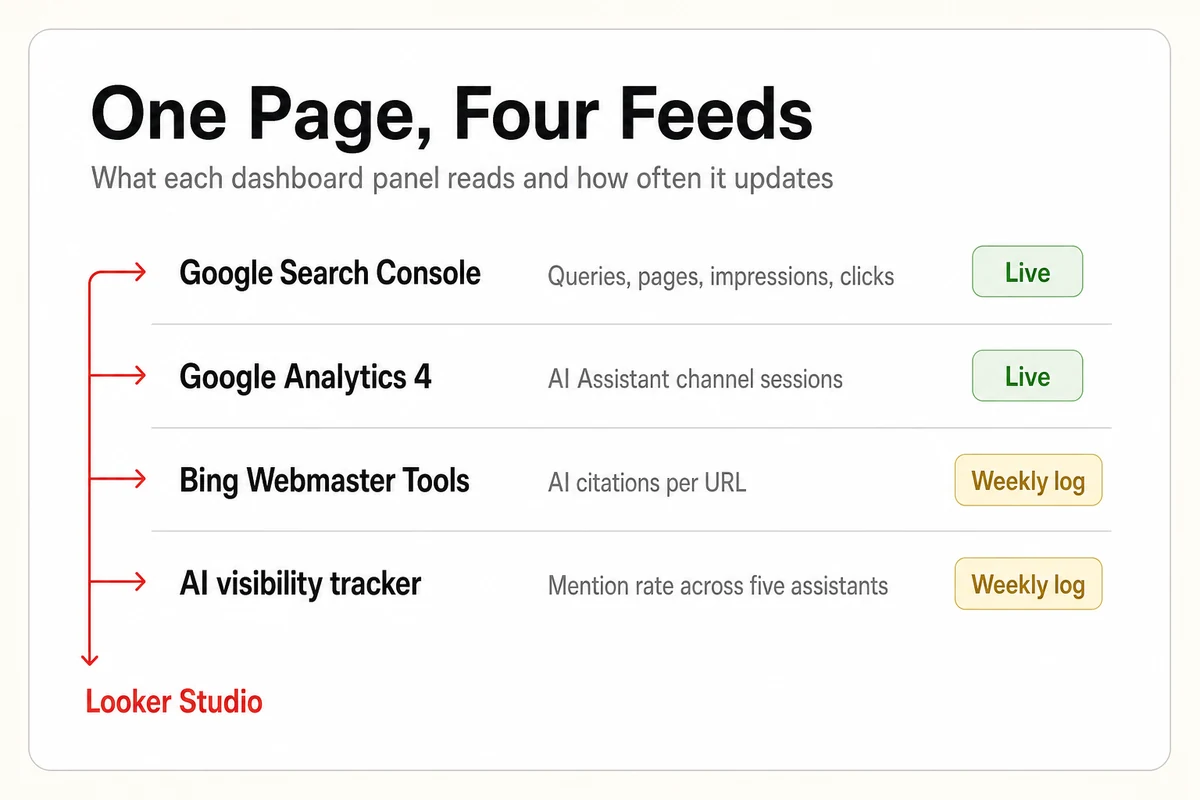
An AI search visibility dashboard is one page that pulls four feeds together. Google Search Console supplies the queries and pages Google shows you for, including how many times AI Overviews and AI Mode surfaced your pages. Google Analytics 4 supplies the visitors who arrived from an assistant. Bing Webmaster Tools supplies the answers that cited your pages, which matters because ChatGPT search draws on Bing's index. And a tracker supplies the one number none of those three report, how often an assistant names your business when a customer asks. Looker Studio, which is free, holds the page. Two of the feeds connect live. The other two you log by hand each Monday in a Google Sheet, which takes about ten minutes. The whole build fits in an afternoon.
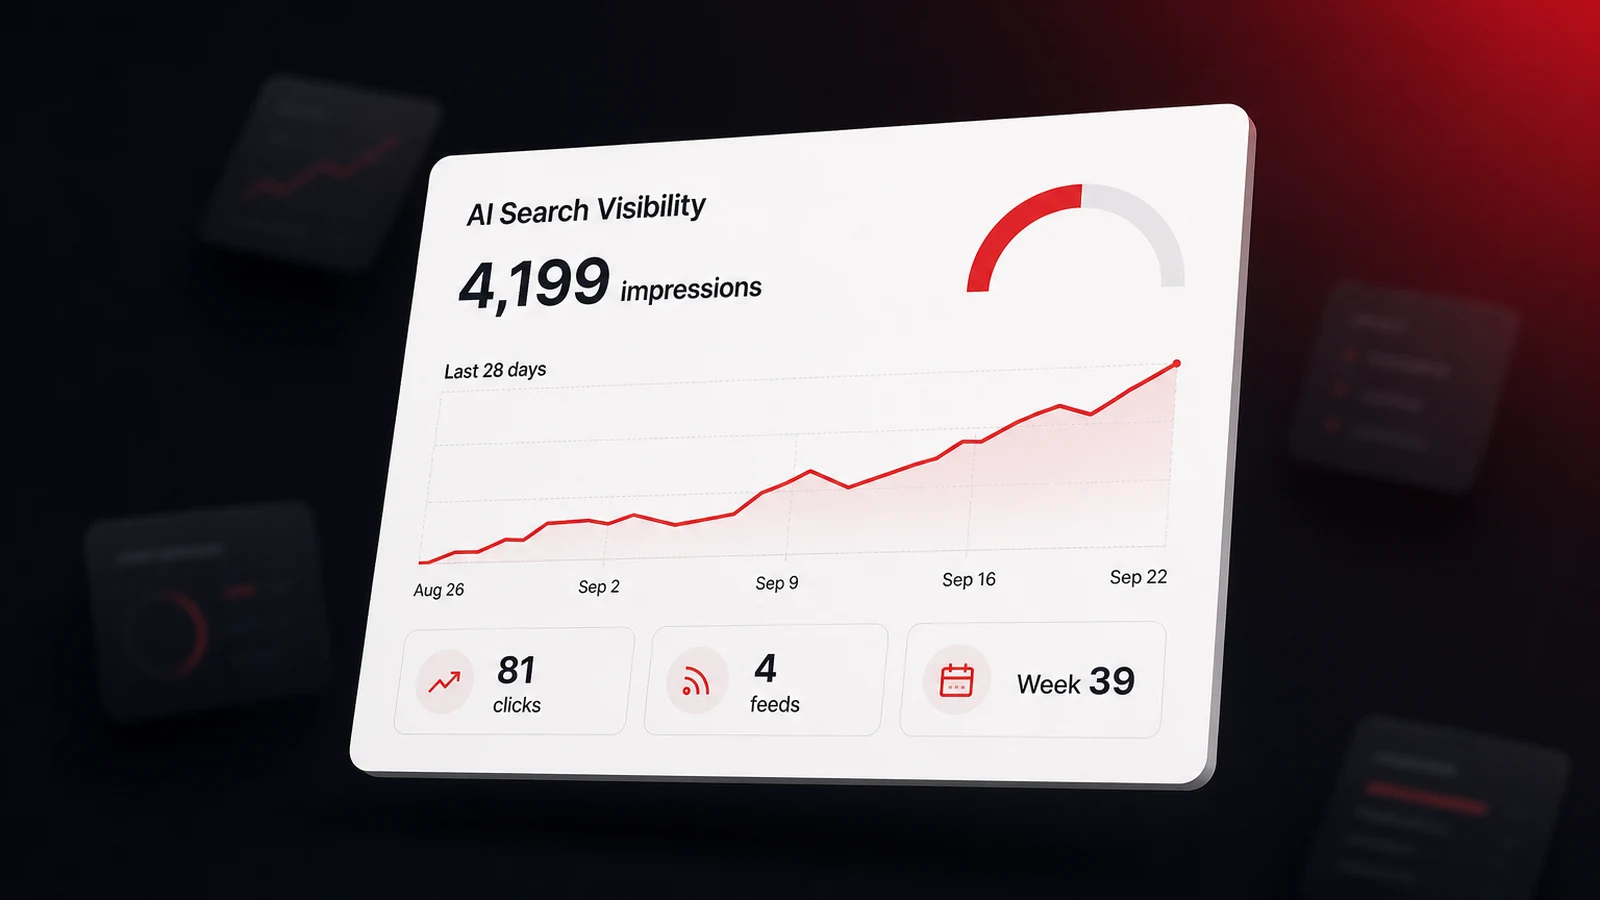
We built ours for this site the week this post went up, so the numbers below are real. Across the four weeks to September 22, 2026, www.lighthouselocal.ai earned 4,199 impressions and 81 clicks in Google. Set the homepage aside, where most visitors were searching our name, and every other page earned one or two clicks, or none, from hundreds of impressions. One of those queries was how do I get an AI search visibility dashboard set up? It appeared 22 times at an average position of 77 and landed on our blog index, because no page answered it. This post is that page. That's what a dashboard is for. It shows you the question you're already being asked and haven't answered yet.
The rest of this guide builds the page one panel at a time. Each panel names the report it reads, the exact fields to pull, and what the number can and can't tell you.
Panel One Is Google's Own Count of Your AI Impressions
Start with Search Console, because it's the only feed that shows demand before the click. In June 2026, Google announced new Search Console insights for generative AI features, described as "impressions metrics and information about which pages appear in AI responses and in what countries." The rollout began with a subset of sites in the UK, and the same post notes that as of August 31, 2026, the report reaches every site worldwide. It reports impressions and the pages that appeared, not clicks, so pair it with the visit data in panel two.
In Looker Studio, add a Search Console data source. Google's connector documentation explains that Search Console reports through two aggregation methods, Site Impression and URL Impression, and one data source can use only one of them. Make two sources. The Site Impression one feeds your site-wide totals. The URL Impression one feeds the page table, since it attributes each impression to the page that appeared. Pull Query, Landing Page, Impressions, Clicks, and Average Position. For the generative AI figure, open the report inside Search Console each Monday and write the week's impressions into the sheet described in panel four.
One filter is worth adding the day you build this. Search Console's Performance report accepts custom regular expressions in its query filter, using RE2 syntax with partial matching by default. Paste this into the Query filter and it returns every query of seven words or more, which is how people phrase a question to an assistant rather than a keyword to a search box.
(\b\w+\b\s){7,}On our site that filter surfaced questions like best AI visibility tracking tools for startups on a tight budget? at position 86 and can we white-label AI visibility tracking for our own clients? at position 4. The first has no page written in its words. The second sits one nudge from the top of the results. Neither would jump out of a keyword list sorted by volume.
Panel Two Shows Who Walked In From an Assistant
Search Console stops at the click. Panel two picks up on your site. Google Analytics 4 assigns a default channel called AI Assistant, and its default channel group definitions spell out the rule. The medium is set to ai-assistant and the campaign to (ai-assistant) whenever the referrer matches Google's list of assistants. You don't tag anything. ChatGPT adds a second signal of its own. OpenAI's publisher FAQ states that ChatGPT automatically includes utm_source=chatgpt.com in referral URLs, so the source column names it even when a browser strips the referrer.
In Looker Studio, add a Google Analytics data source. Google's GA4 connector exposes the same dimensions the Analytics interface does. Build one table with Landing page as the dimension, Sessions and Key events as the metrics, and a filter where Session default channel group equals AI Assistant. Add a second, smaller table with Session source as the dimension so you can see which assistant sent each visit. If your site records a signup, booking, or call as a key event, this table answers the question every other SEO report leaves open. Which pages turn assistant visitors into customers, and which pages just get visited.
Set your expectations by the benchmarks before you read it. In Conductor's AEO and GEO benchmarks report, updated in July 2026 and covering 13,770 domains across ten industries, AI referral traffic accounts for 1.08% of all website traffic. For a local business that's a handful of sessions a week, so the number worth watching is the trend and the landing page, not the total.
Panel Three Reads Bing, Because ChatGPT Does
Most local businesses never open Bing Webmaster Tools, and for a dashboard like this one that's a mistake, because ChatGPT search partners with outside providers and names Microsoft among them, as our guide on what AI says about your business lays out. Bing's AI Performance report is the closest thing to a citation log for ChatGPT answers that you can get without a tracker. In June 2026, Bing expanded that report with Intents, Topics, Citation Share, and Compare views, and framed the whole thing around one question, "Where is my content being cited in AI-generated answers?"
Verify your site there once, using the same DNS or meta-tag route as Search Console. Then, each Monday, open AI Performance, note the week's citation count and the top cited URL, and write both into the sheet. There's no Looker Studio connector for this report, so the sheet is the bridge. Two numbers a week is enough. What you're looking for is a page that Bing's AI answers cite that Google's report never shows you, or the reverse, since the two indexes disagree far more often than people expect.
Panel Four Is the Number None of Them Report
Search Console, GA4, and Bing together tell you when your pages were shown, cited, and visited. None of them tell you whether AI recommends your business. A customer who asks ChatGPT, Gemini, Claude, Perplexity, or Google AI for a plumber gets a short list of names, and your mention rate is the share of those answers that include yours. Our guide on measuring your brand across AI search defines the four numbers that describe it, mention rate, cited rate, position in the list, and the sentiment of the description, along with how many answers you need to sample before a change means anything.
You can log this by hand. Pick twelve customer questions, ask each assistant once a week, tally the answers that name you, and enter the share in the sheet. Lighthouse Local's AI visibility tracker does the same thing on a schedule, across the five we track, and keeps the captured answers so you can read why a mention appeared or vanished. Either way the number goes in the same column. The sheet is the fourth data source, and here are its columns.
week_start,gsc_ai_impressions,bing_ai_citations,bing_top_cited_url,mention_rate,cited_rate,notesFill one row every Monday. Six cells, a date, and a note about what you changed on the site that week. In three months the notes column is the most useful thing on the dashboard, because it's the only place that records cause next to effect. You're less alone in this than you might think. In Fractl's Q2 2026 survey of marketers and consumers, which polled 150 marketers and 1,008 US consumers, 49% of marketers said they now actively monitor LLM impact on brand visibility, up from 22% in 2025. Most of them are logging something very close to this row.
Blend the Sheet and the Feeds Into One Looker Studio Page
Looker Studio is Google's report builder, and its product documentation describes it as a no-cost tool, so the whole dashboard costs nothing but the afternoon. Create a blank report and add the four sources, the two Search Console sources from panel one, the GA4 source from panel two, and the Google Sheet from panel four through the Google Sheets connector. Then lay out one page in three rows.
The top row is four scorecards, one per feed. Total impressions from the Site Impression source, AI Assistant sessions from GA4, and this week's Bing citations and mention rate from the sheet. The middle row is one time series with two lines, impressions and clicks by week, from Search Console. The bottom row is the page table from the URL Impression source, and this is where blending earns its keep. Google's guide to how blends work in Looker Studio explains that a blend combines several sources into one chart or table on a shared field. Blend the Search Console page table with the GA4 table on Landing page, and each row shows impressions, clicks, assistant sessions, and key events for the same URL.
Here's what our own bottom row looked like the week we built it, from the URL Impression source, for the same four weeks to September 22, 2026.
| Page | Impressions | Clicks | Avg. position |
|---|---|---|---|
| Small business tools post | 580 | 2 | 29.8 |
| For Business page | 369 | 1 | 5.9 |
| Homepage | 315 | 43 | 4.6 |
| Agency tools post | 285 | 1 | 32.3 |
| Recommended by AI post | 228 | 0 | 30.3 |
| Answer engines post | 174 | 1 | 17.2 |
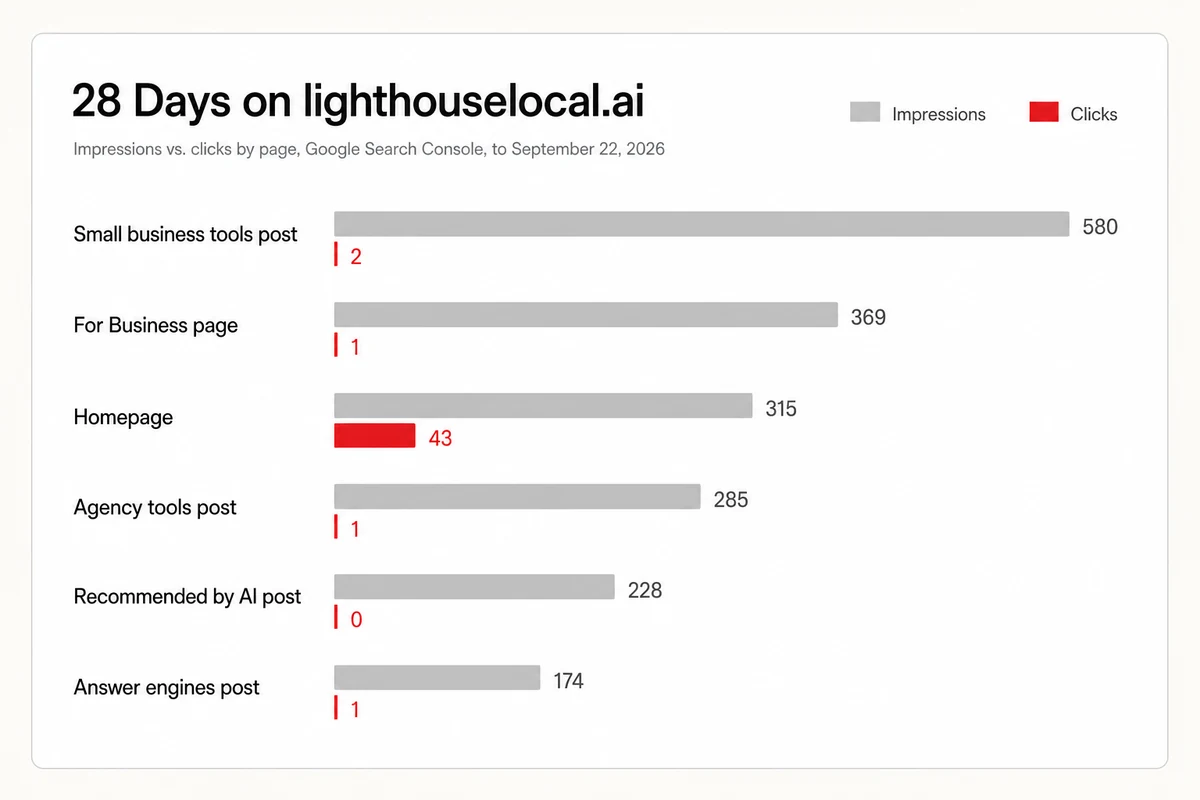
Read the homepage row against the rest. Its 43 clicks are almost entirely people searching our name. Every other row is a page Google shows hundreds of times for questions we didn't write for, at positions in the twenties and thirties, earning one or two clicks each. That gap between what we're shown for and what we're chosen for is the same branded versus unbranded gap that shows up in AI answers, and the dashboard makes it visible in a way a monthly traffic total never would.
Read It Every Monday With Five Questions
A dashboard nobody reads is a screensaver. Ours gets ten minutes every Monday, after the sheet row is filled, and the reading always follows the same five questions.
- Which queries sit at position 3 to 20? Sort the Search Console table by position and filter out your brand. These are pages Google already likes. Adding the exact query phrase to the page's title and first paragraph is often enough to move one, and it costs an hour, not a new post.
- Which pages are shown and never clicked? Hundreds of impressions at a low click-through rate means the title promised the wrong thing. Rewrite the title and description before writing anything new.
- Which page lost a third of its impressions since last week? Compare the two most recent weeks in the time series. A drop that size on one page is usually a competitor's fresher page, and a dated update with a new section is the fix.
- Which seven-plus-word questions have no page? Run the regex filter from panel one. A question that appears twenty times and lands on your blog index, the way ours did, is a page waiting to be written in the reader's own words.
- Did the mention rate move, and on which assistant? Read the sheet's last four rows together. One week is noise. Four weeks in the same direction, next to a note about what you changed, is a result.
Notice that four of these five questions lead to fixing a page you already have, and only one leads to writing. That ratio is the point of the whole build. Most sites publish blind for months because nobody reads the report, then write more of what already isn't working. If the fixing is the part you'd rather not own, Lighthouse Local for Business has specialists make the on-page changes, with your approval on each one. And the pages the dashboard flags each week are on-site problems, so a free Lighthouse Local audit gives you the ranked fix list to work down while the panels fill in. Build the page, fill the row, ask these five questions, and let the notes column tell you what worked.
Frequently asked questions
Is an AI search visibility dashboard free to build?
Yes. Google Search Console, Google Analytics 4, Bing Webmaster Tools, and Looker Studio are all free, and the weekly log is a Google Sheet. The only paid piece is optional, a tracker that measures how often assistants name your business, which you can replace with twelve hand-run prompts a week.
Does Google Search Console show clicks from AI Overviews?
No. The generative AI insights Google rolled out worldwide in August 2026 report impressions and which pages appeared in AI responses, by country. Clicks from those features aren't broken out, so pair the report with the AI Assistant channel in GA4 to see visits.
How does GA4 know a visitor came from ChatGPT?
Two ways. GA4 assigns the AI Assistant default channel automatically when the referrer matches its list of assistants, setting the medium to ai-assistant. ChatGPT also appends utm_source=chatgpt.com to the links it shows, so the session source names it even when the referrer is missing.
Can Looker Studio show whether ChatGPT recommends my business?
Not on its own. Search Console, GA4, and Bing report impressions, visits, and citations, not whether an assistant named you. That mention rate comes from a tracker or from asking the assistants yourself each week, logged in a Google Sheet that Looker Studio then reads like any other source.
How often should I check the dashboard?
Once a week is right for a local business. Fill the sheet row, then spend ten minutes on the same five questions, almost-there queries, shown-but-unclicked pages, weekly drops, unanswered long questions, and mention-rate movement. Daily checks just show noise, and monthly checks miss the fixable dips.